Drawing a graph with alert and warning areas
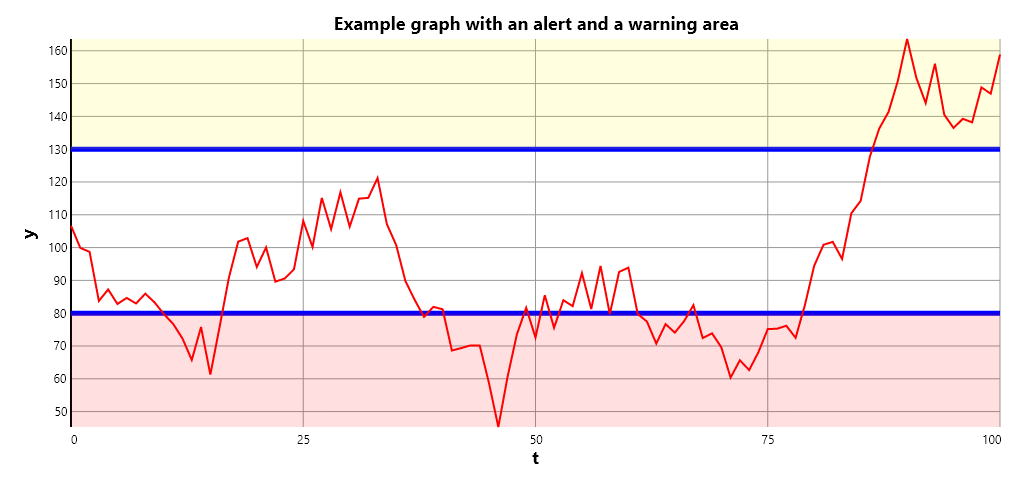
The following script draws a plot graph, with two visible areas, one alert area, and one warning area. This script can be used as an example of how such a graph computation can be performed. It also illustrates graph arithmetics, where simpler graphs can be combined into a composite graph, using the + operator.
Example:
Next(x,a,c,d):=x+(a-x)/c+Uniform(-d,d);

t:=0..100;
x0:=100;
y:=[foreach x in t do (x1:=Next(x0,100,50,15);x0:=x1)];

GraphWidth:=1024;
GraphHeight:=480;

MinLimit:=80;
MaxLimit:=130;
MinT:=Min(t);
MaxT:=Max(t);
MinY:=Min(y);
MaxY:=Max(y);

LowerLimit:=plot2dline([MinT,MaxT],[MinLimit,MinLimit],"Blue",5);
if MinY<MinLimit then LowerLimit+=polygon2d([MinT,MaxT,MaxT,MinT],[MinLimit,MinLimit,MinY,MinY],Alpha("Red",32));

UpperLimit:=plot2dline([MinT,MaxT],[MaxLimit,MaxLimit],"Blue",5);
if MaxY>MaxLimit then UpperLimit+=polygon2d([MinT,MaxT,MaxT,MinT],[MaxLimit,MaxLimit,MaxY,MaxY],Alpha("Yellow",32));

G:=LowerLimit+UpperLimit+plot2dline(t,y,"Red");
G.Title:="Example graph with an alert and a warning area";
G.LabelX:="t";
G.LabelY:="y";
G
Would generate something like;

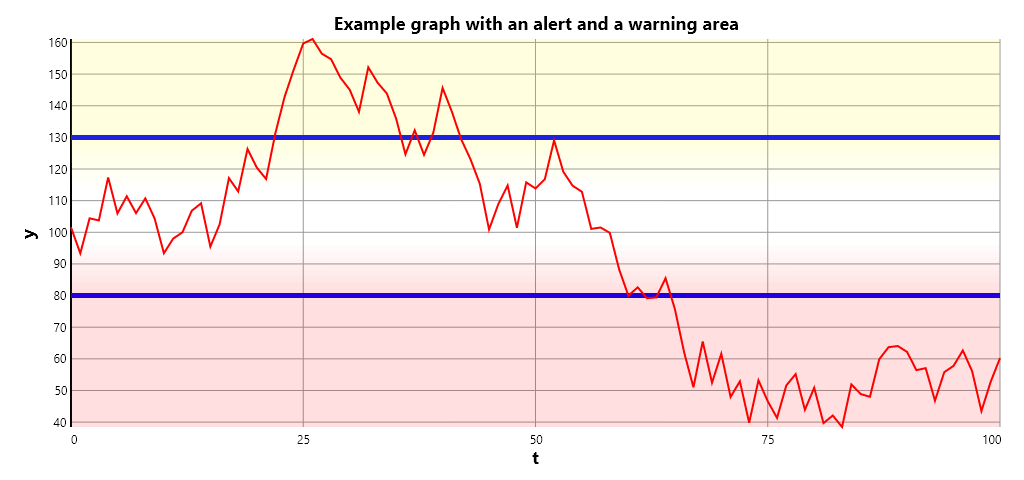
If you want to add a smooth gradient, you can sum a sequence of polygon areas with increasing degrees of alpha as well.
Example:
Next(x,a,c,d):=x+(a-x)/c+Uniform(-d,d);

t:=0..100;
x0:=100;
y:=[foreach x in t do (x1:=Next(x0,100,50,15);x0:=x1)];

GraphWidth:=1024;
GraphHeight:=480;

MinLimit:=80;
MaxLimit:=130;
MinT:=Min(t);
MaxT:=Max(t);
MinY:=Min(y);
MaxY:=Max(y);

LowerLimit:=plot2dline([MinT,MaxT],[MinLimit,MinLimit],"Blue",5);
foreach a in 1..8 do
(
	b:=2*(8-a);
	LowerLimit+=polygon2d([MinT,MaxT,MaxT,MinT],[MinLimit+b,MinLimit+b,MinLimit+b+2,MinLimit+b+2],Alpha("Red",a*4))
);
if MinY<MinLimit then
	LowerLimit+=polygon2d([MinT,MaxT,MaxT,MinT],[MinLimit,MinLimit,MinY,MinY],Alpha("Red",32));

UpperLimit:=plot2dline([MinT,MaxT],[MaxLimit,MaxLimit],"Blue",5);
foreach a in 1..8 do
(
	b:=2*(9-a);
	UpperLimit+=polygon2d([MinT,MaxT,MaxT,MinT],[MaxLimit-b,MaxLimit-b,MaxLimit-b+2,MaxLimit-b+2],Alpha("Yellow",a*4))
);
if MaxY>MaxLimit then
	UpperLimit+=polygon2d([MinT,MaxT,MaxT,MinT],[MaxLimit,MaxLimit,MaxY,MaxY],Alpha("Yellow",32));

G:=LowerLimit+UpperLimit+plot2dline(t,y,"Red");
G.Title:="Example graph with an alert and a warning area";
G.LabelX:="t";
G.LabelY:="y";
G
Gives a graph similar to this:

Posts tagged #graph
No more posts with the given tag could be found. You can go back to the main view by selecting Home in the menu above.